
Most brands fix frequency response. We fix time.
Frequency response tells you what a monitor gets right at steady state. Time domain tells you what it does with everything else. Every transient, every decay, every phase relationship. That is where monitoring accuracy is won or lost.
Frequency response is a steady-state measurement.
A frequency response plot tells you how a monitor responds to a continuous sine wave at each frequency. It says nothing about what happens in the first few milliseconds when a transient arrives. It says nothing about how quickly the driver settles after a transient passes. It says nothing about the phase relationships between your low end and your midrange.
Music is not just a series of continuous sine waves. It is a series of transients. Kick drums, snares, plucked strings, consonants in a vocal. Every one of those events tests the time domain performance of your monitoring system.
When a monitor has poor time domain performance, you hear smearing. The kick drum and the bass guitar are both in time in your session but they sound like they overlap in the room. You compensate. You EQ things that don't need EQ. You add processing to create separation that should already be there. Then you send the mix to another room and it falls apart.
Fixing frequency response is necessary but not sufficient. A flat frequency response with poor phase coherence is still an inaccurate monitor. The measurement that matters is the impulse response, which shows you both at once.
Every crossover introduces phase shift.
A traditional crossover splits the audio signal between drivers. The filters that do the splitting introduce phase shift at every crossover frequency. In a two-way monitor, the woofer and tweeter fight each other across the crossover region, producing a dip in the impulse response and comb filtering off-axis. In a three-way design, that problem exists at two crossover points simultaneously. Add a subwoofer, and you have three phase relationships to manage at once, each one capable of smearing transients, collapsing the stereo image, and misrepresenting the low end.
Active analog crossovers are an improvement, but they implement filters with fixed poles and zeros. Phase shift is baked into the topology. More critically, an analog crossover is designed against a theoretical target. It has no way to account for the actual acoustic behavior of each driver in the cabinet, its real-world phase response, its resonance characteristics, the way its output interacts with the enclosure. Every unit leaves the factory with those variables unresolved.
The approach we use is a zero-phase digital crossover combined with individual driver linearization. The DSP measures the actual acoustic output of each driver in situ, determines its exact phase and magnitude response, and applies corrections that bring every driver to a flat, linear phase target simultaneously, regardless of how many crossover points are in the signal path. Corrections are applied against real-world behavior, not theoretical targets, and can be refined with every firmware update. Because the DSP runs natively at 192kHz, timing corrections resolve to approximately 5 microseconds. Phase shift at the crossover points is reduced to less than one sample.
±15° phase deviation from 30Hz to 30kHz. Every driver in the system is in phase with every other driver at every frequency across the operating range. The impulse response is a clean, sharp spike. No pre-ringing, no post-ringing, no smear.
Zero-phase crossovers mean the stereo image doesn’t collapse as you move off-axis. The sound stage you built in the mix is the same whether you are at the mix position or across the room.
Every unit is different. Every unit is corrected.
Manufacturing tolerances mean no two drivers are identical. A 1dB variation in driver sensitivity at a critical frequency, multiplied across all the drivers in a three-way system, produces a monitor that measures differently from the design target. Most manufacturers accept this. We do not. We measure each driver to ensure it performs within a tight tolerance window, to ensure every driver meets our exacting standards.
Each driver is measured individually before assembly. Frequency response, impedance, and phase response are characterized. Drivers that fall outside tolerance are rejected. Drivers that pass are matched to their calibration target.
Each unit is measured individually after assembly, driver by driver, in our anechoic chamber. Those measurements feed a continuously growing database. The correction coefficients applied to each driver channel are derived from that accumulated data, refined over time as the database grows and our understanding of how each driver behaves improves. Every unit is verified against the same absolute target before it ships.
As our measurement capabilities and algorithms improve over time, updated correction sets are distributed over the air to every unit in the field. Your monitor gets more accurate as our research advances at measuring. No recalls, no hardware changes, no service visits.
Your monitor improves after you buy it.
Our DSP architecture applies discrete, phase-correct corrections to each driver independently, with zero-phase crossovers at 200Hz and 2kHz. The coefficients come from an accumulated database of every unit we have measured, continuously refined as that database grows and our algorithms improve. As it does, updated correction sets are pushed over the air to every unit in the field. A monitor you buy today will measure better in two years than it does now, not because anything in it changed, but because our model of what it is doing will be more refined.
We have never charged for a calibration update. We never will.
How every unit
gets measured.
Anechoic measurement
Every unit is measured in our anechoic chamber at the calibration position. Sine sweep measurements for each individual driver capture the full frequency, phase, and impulse response of the speaker as assembled. No gating, no compensation, no approximation.
Driver-level correction
Each unit's driver measurements enter our population database. Correction coefficients derived from that accumulated data are applied to each driver channel individually, discrete corrections with no interpolation across the crossover. The target is magnitude linearity within ±1.5dB and phase deviation within ±15° across the full operating range.
Verification measurement
After corrections are applied, the system is re-measured to verify the calibration met the target. Units that do not meet specification are re-calibrated. Units that pass receive a calibration certificate and ship with their correction data stored in the DSP.
Matched pairs
Because every unit is calibrated to the same absolute target, any two units of the same model are a matched pair. There is no need to request matched pairs, no premium for matching. Every unit ships calibrated. Every unit is the same.
Terra. Every measurement, published.
These are Terra's measurements, taken at the calibration position. Frequency response, impulse response, phase response, polar response, and THD. We publish all of them because we have nothing to hide. The measurements are not marketing. They are the proof.
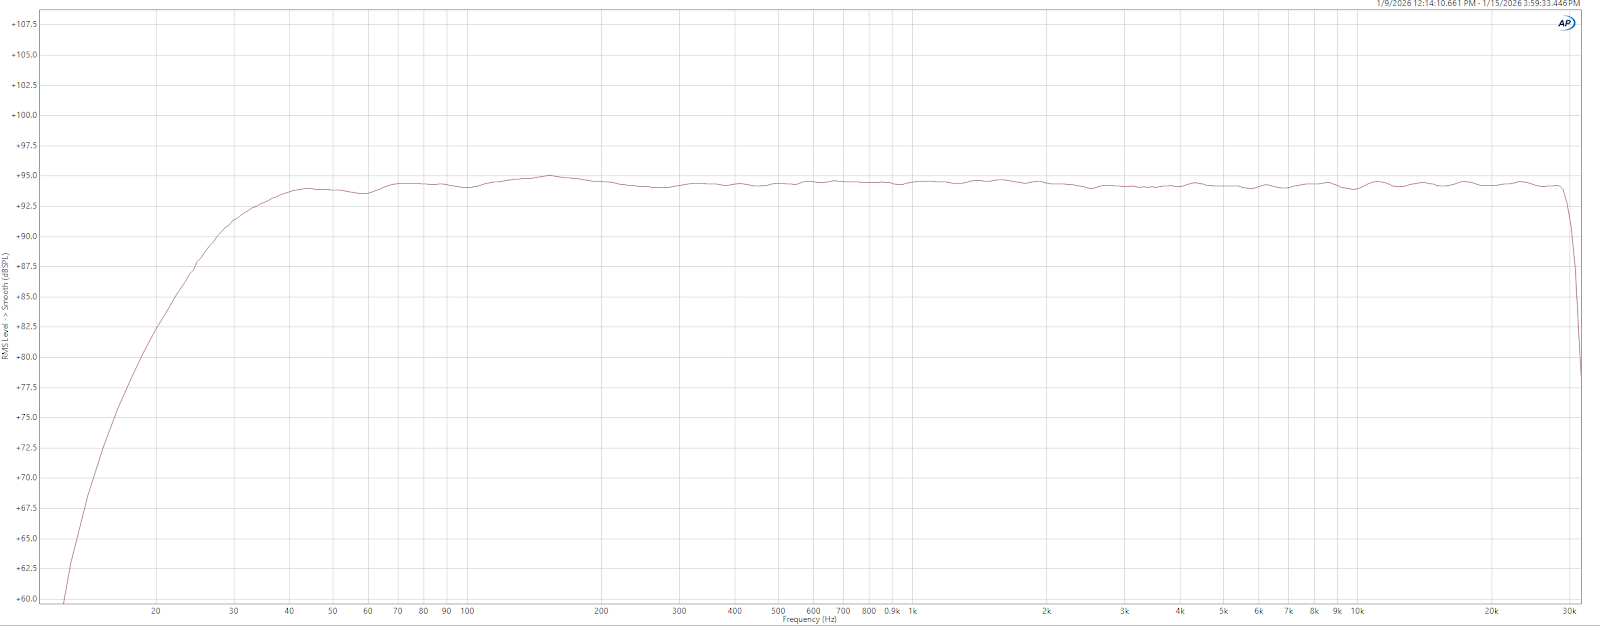
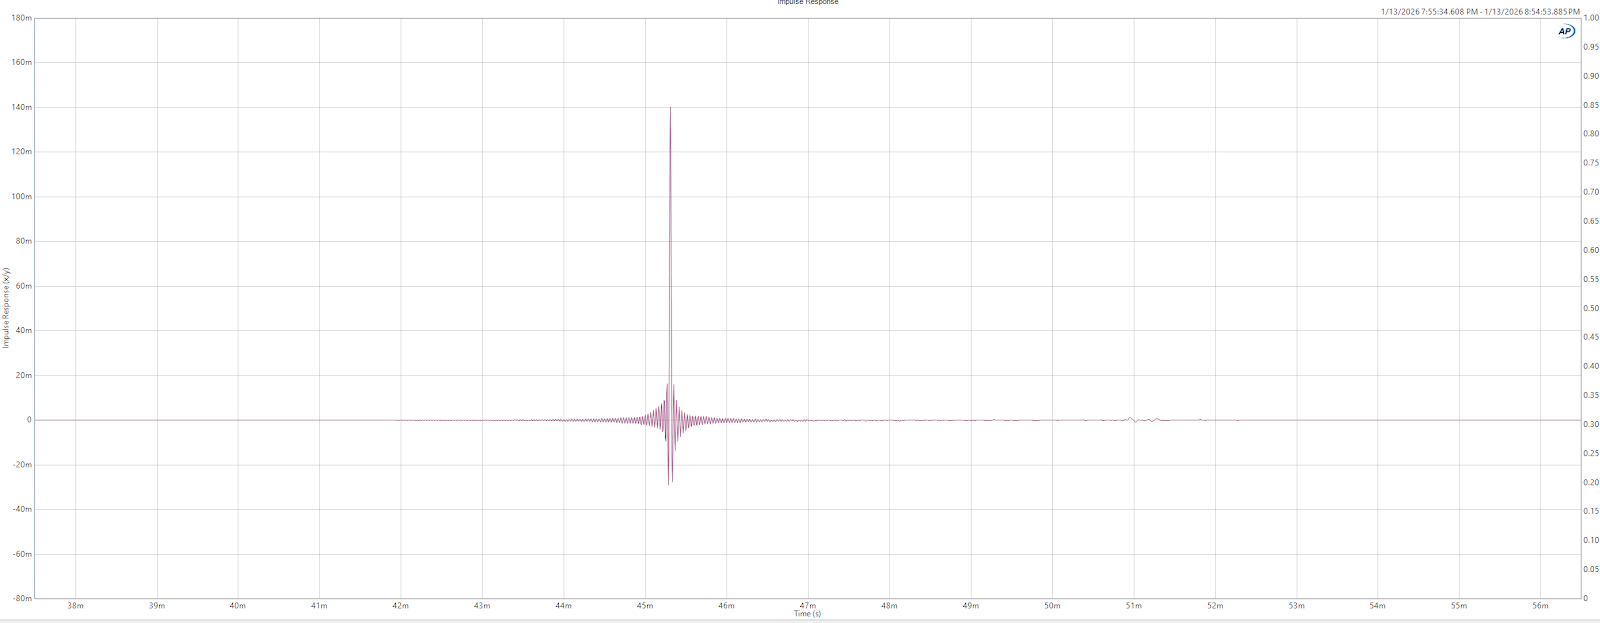
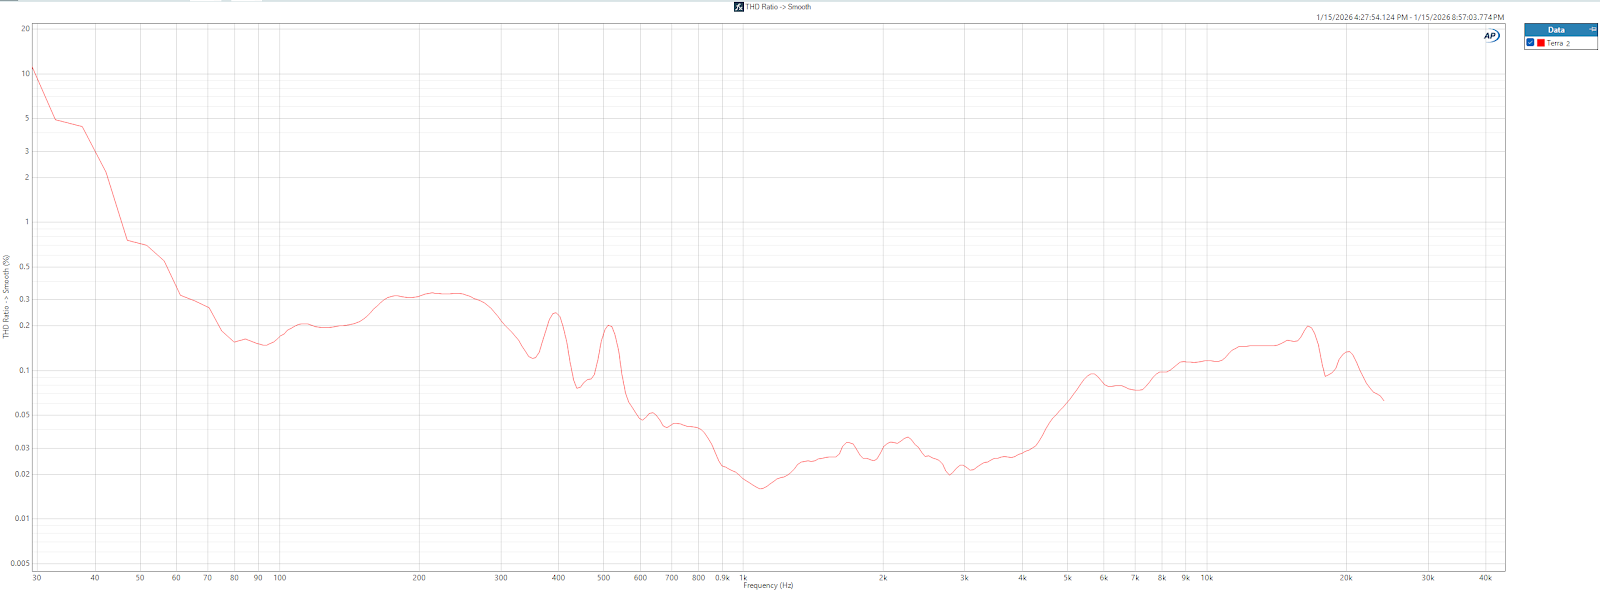
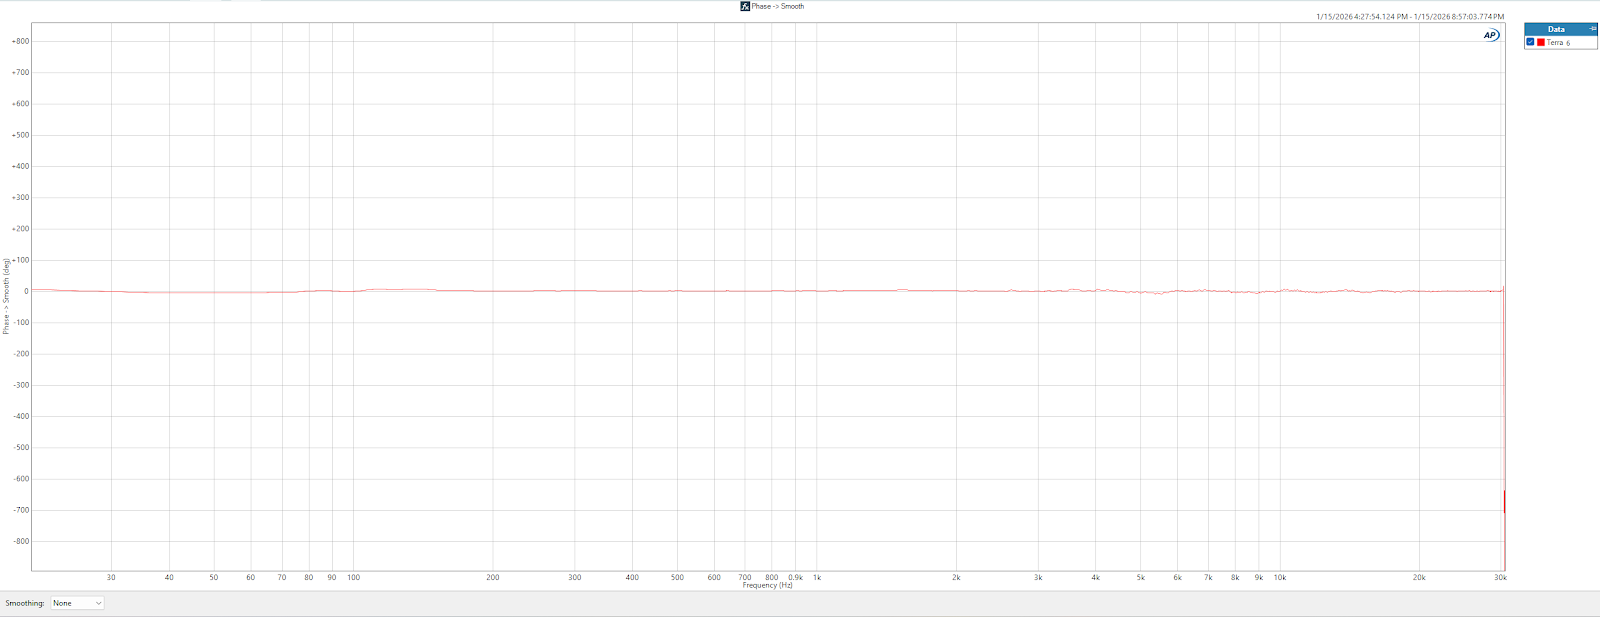
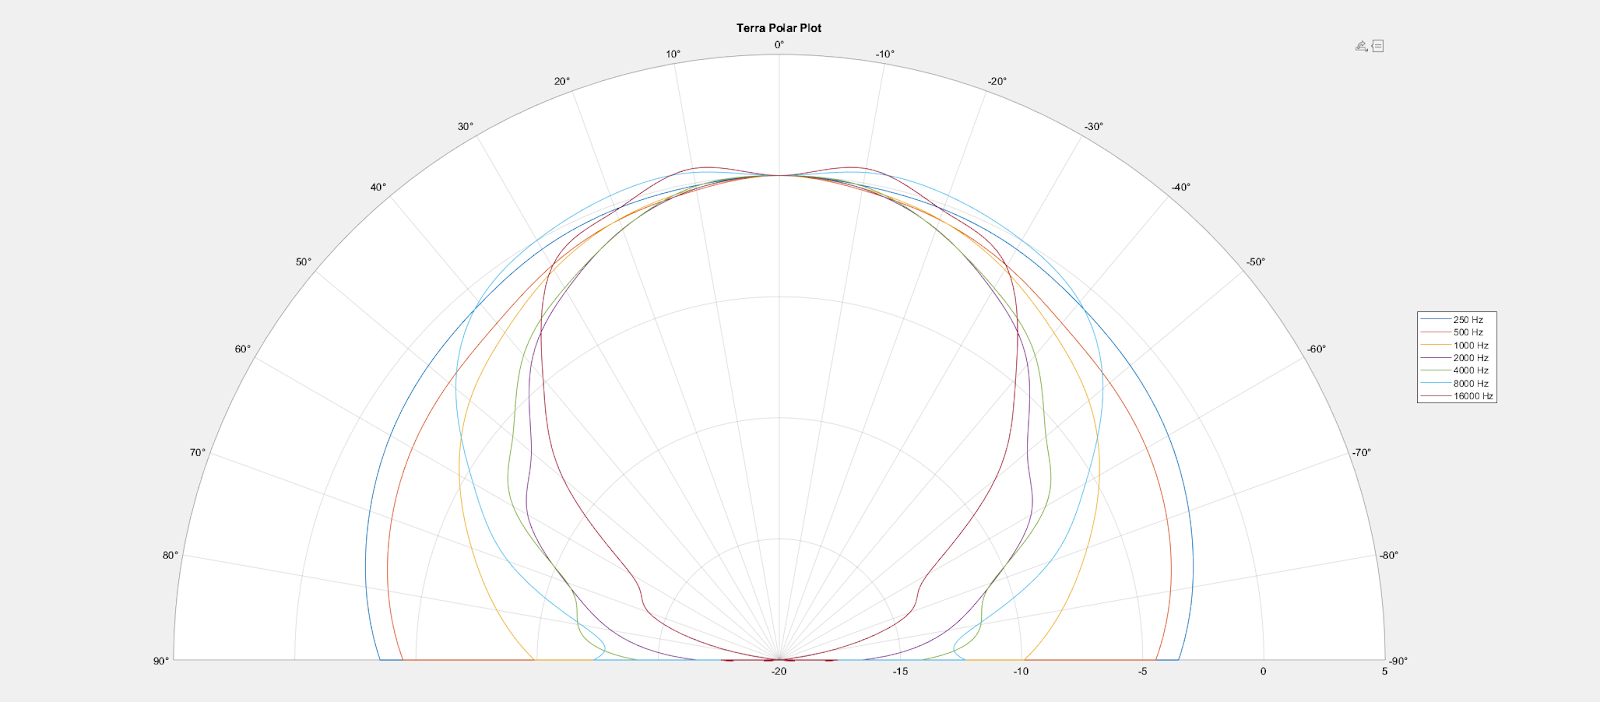
Every unit ships with its own calibration data stored in DSP, measured and verified at the time of manufacture.